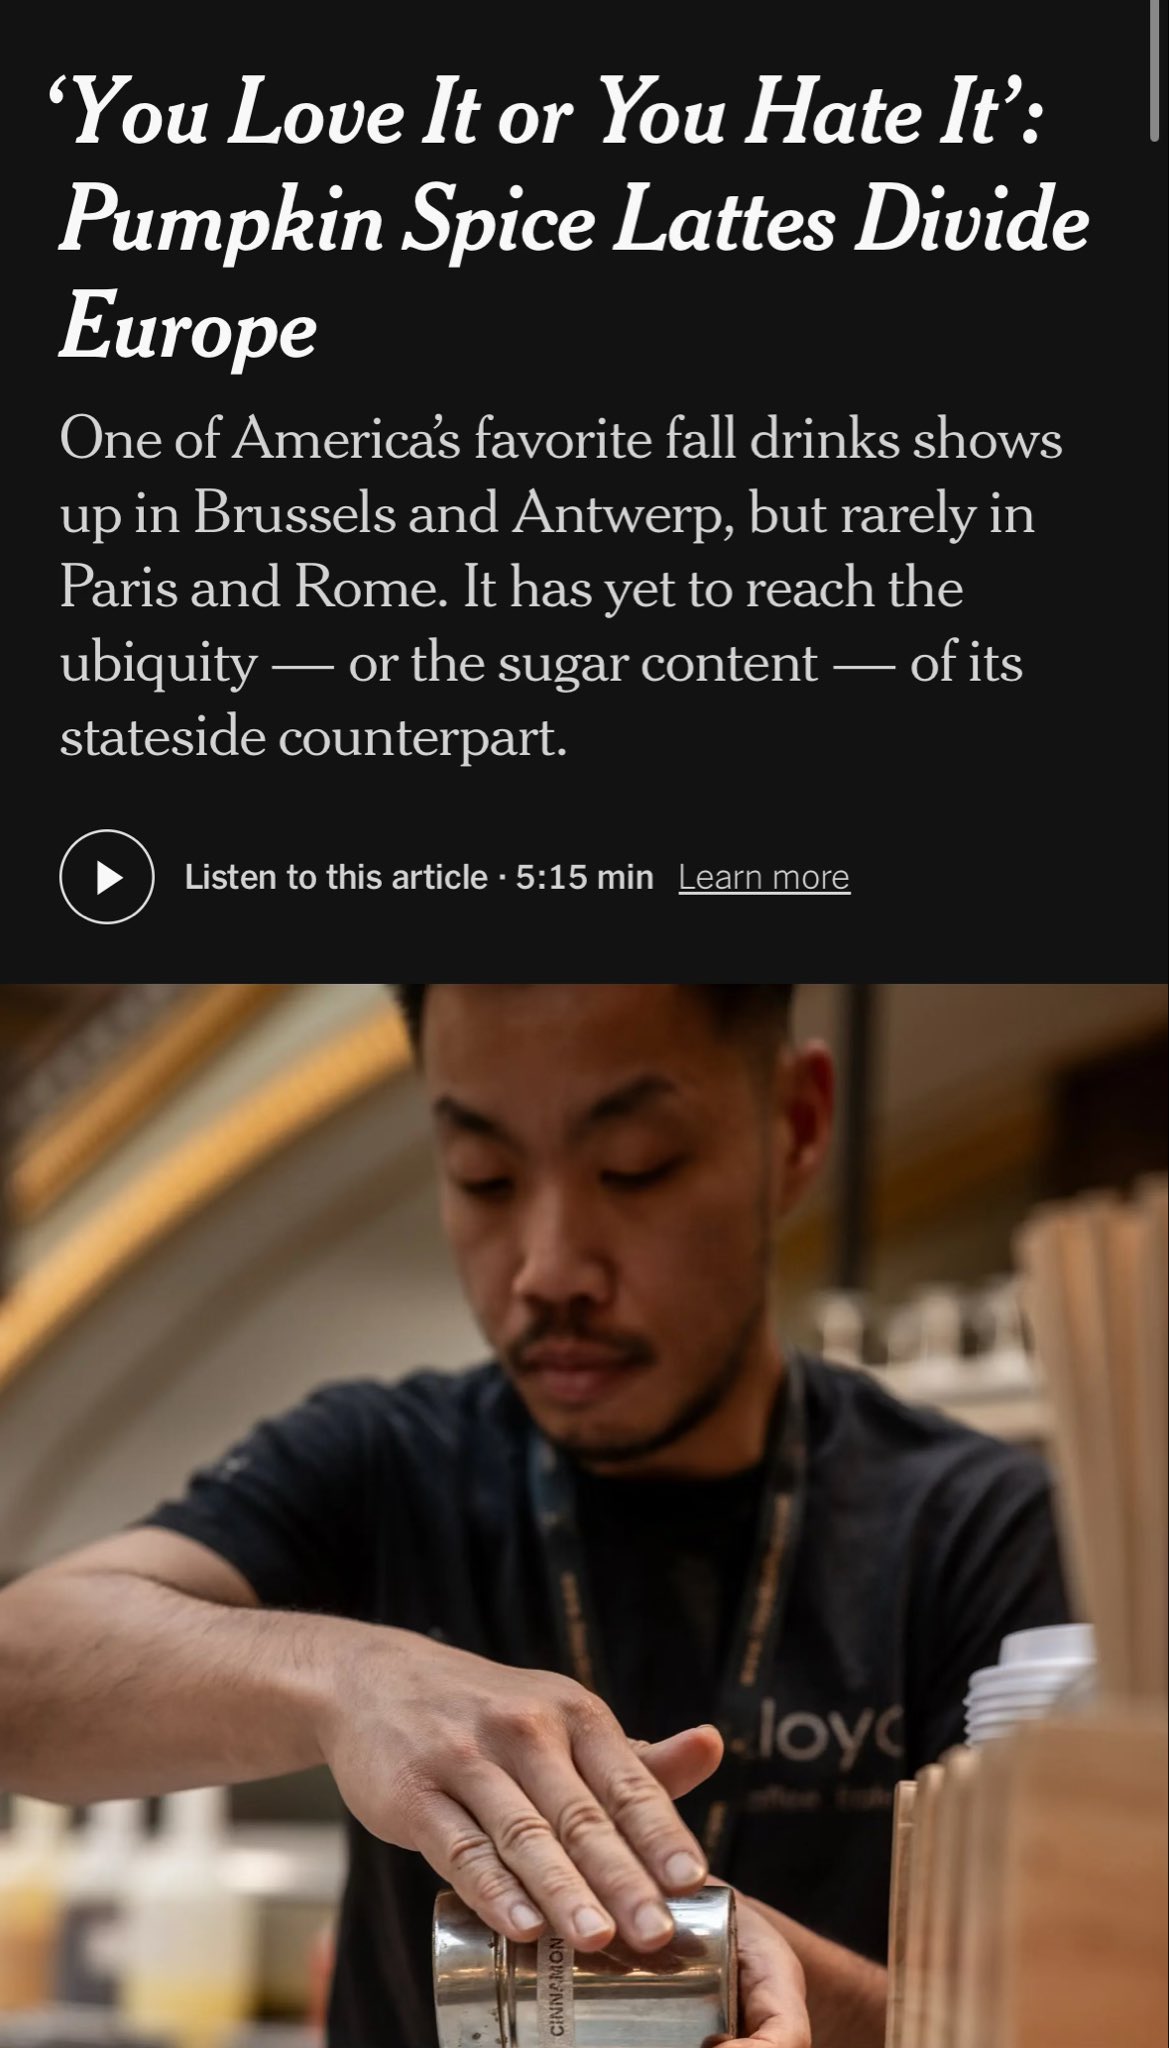
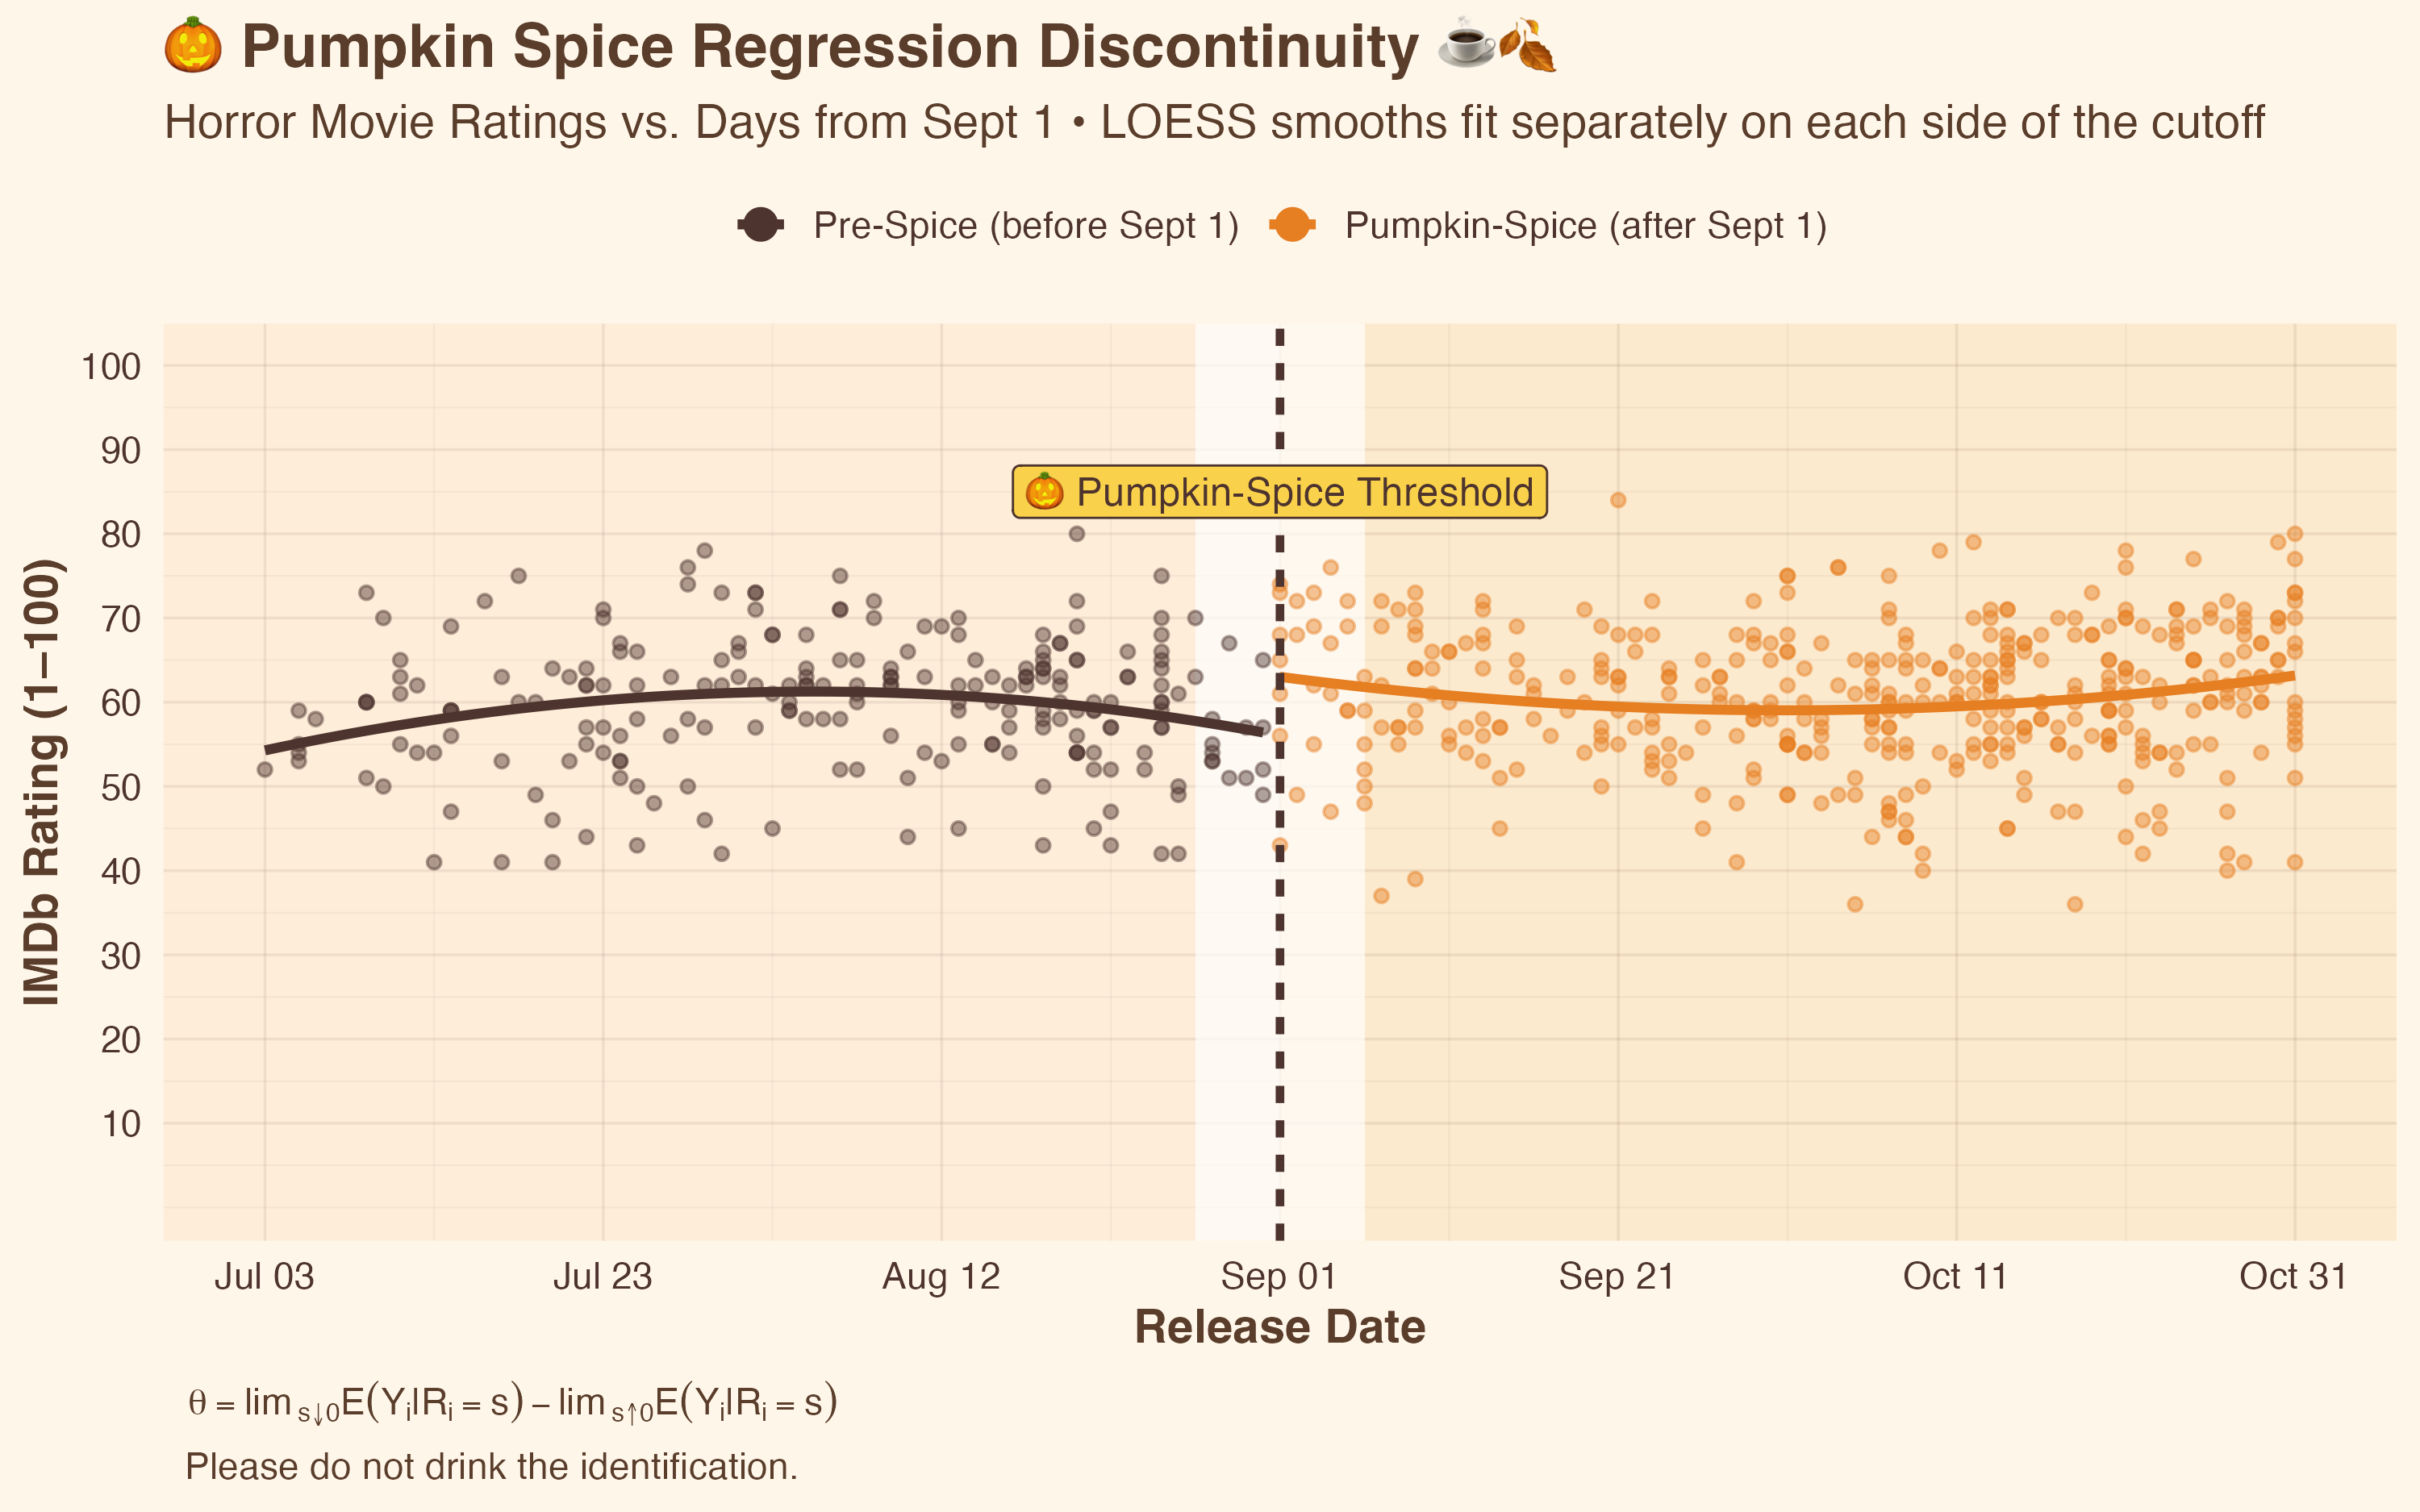
I hypothesize that entering into the Pumpkin Spice Season has a causal effect of increasing the success of horror movies as measured by IMDb user ratings.
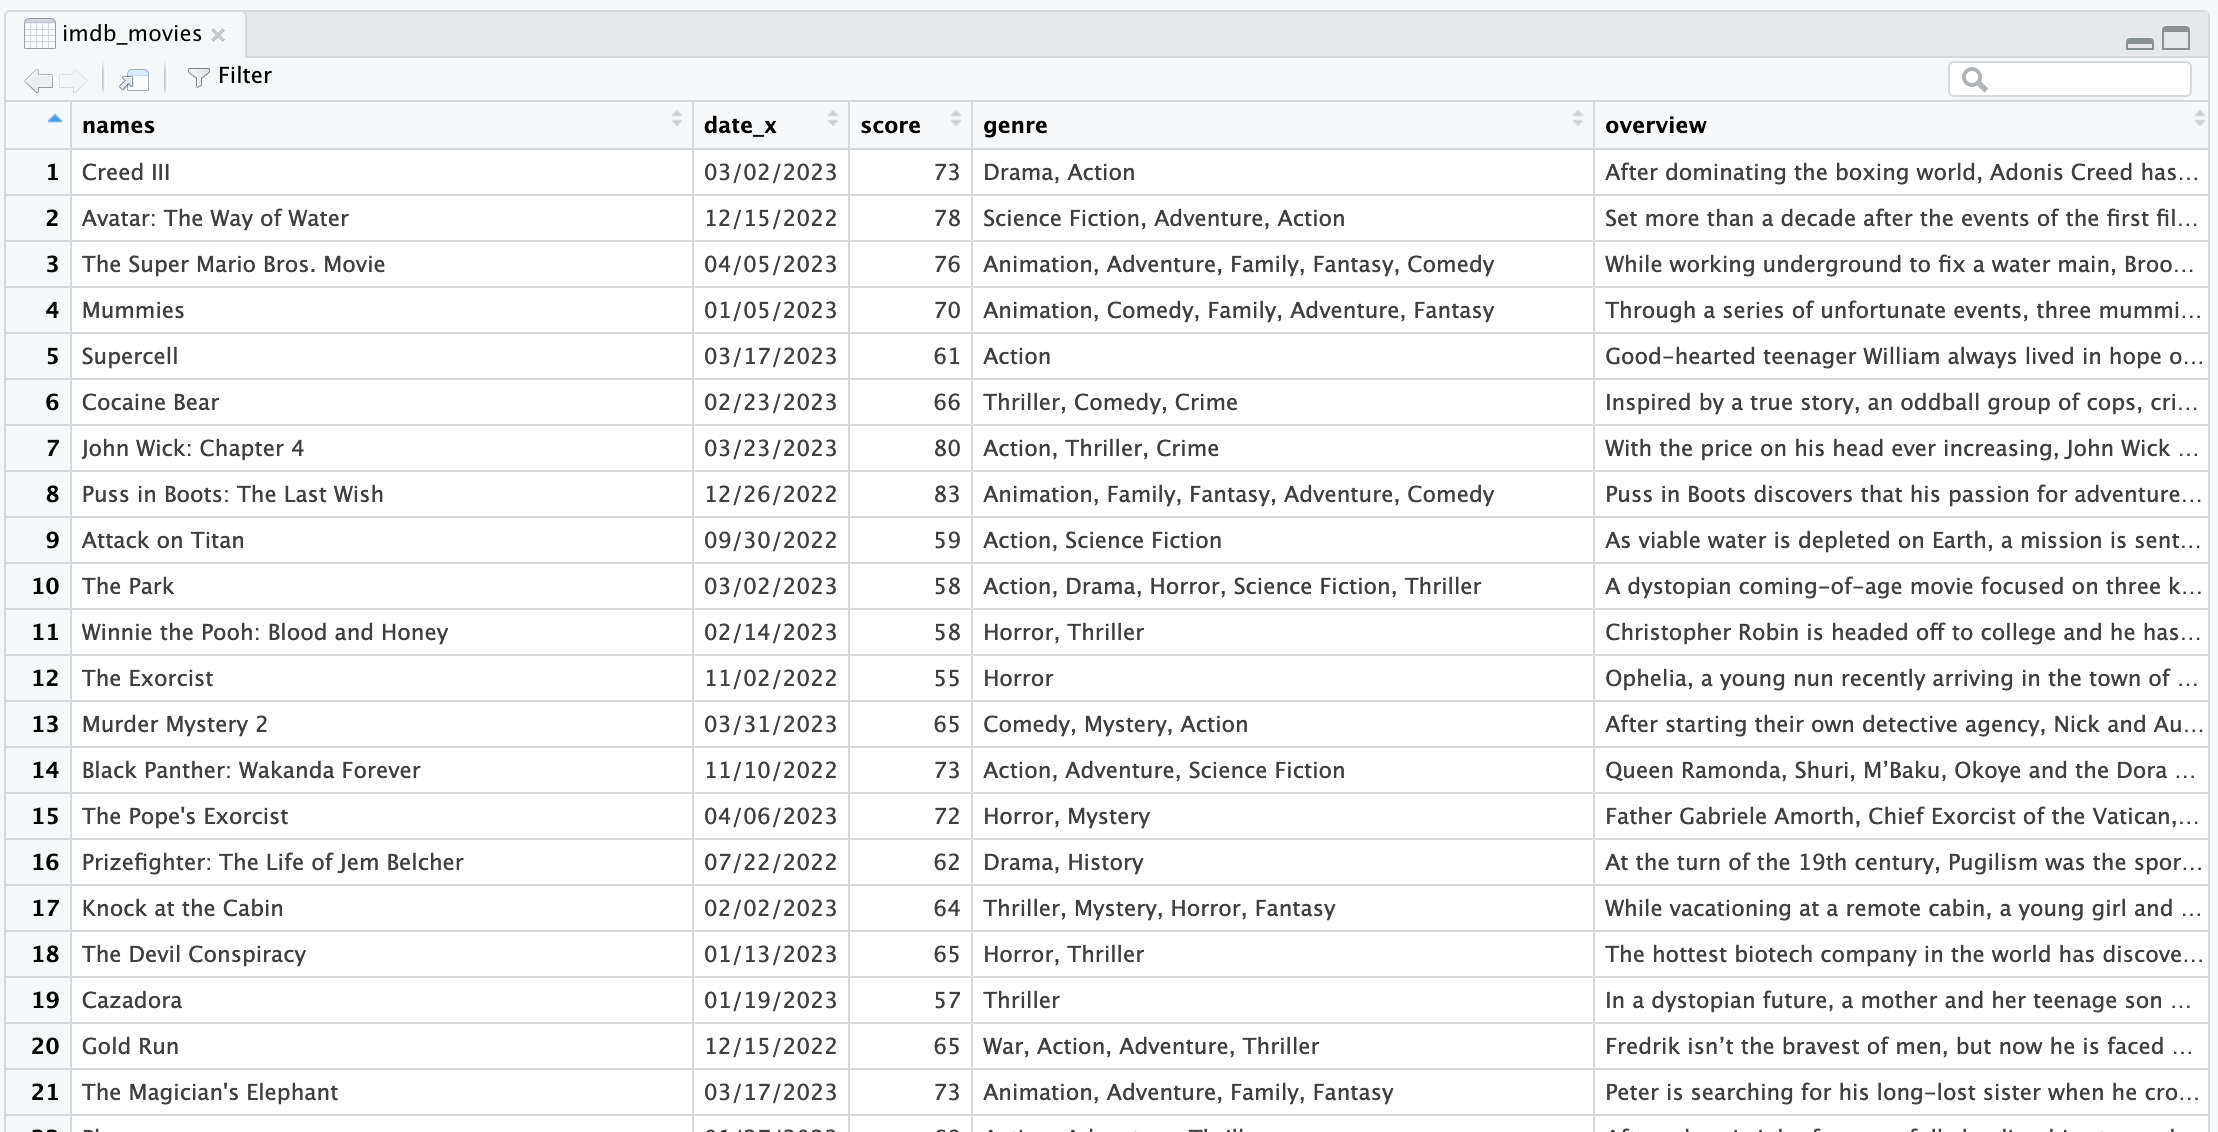
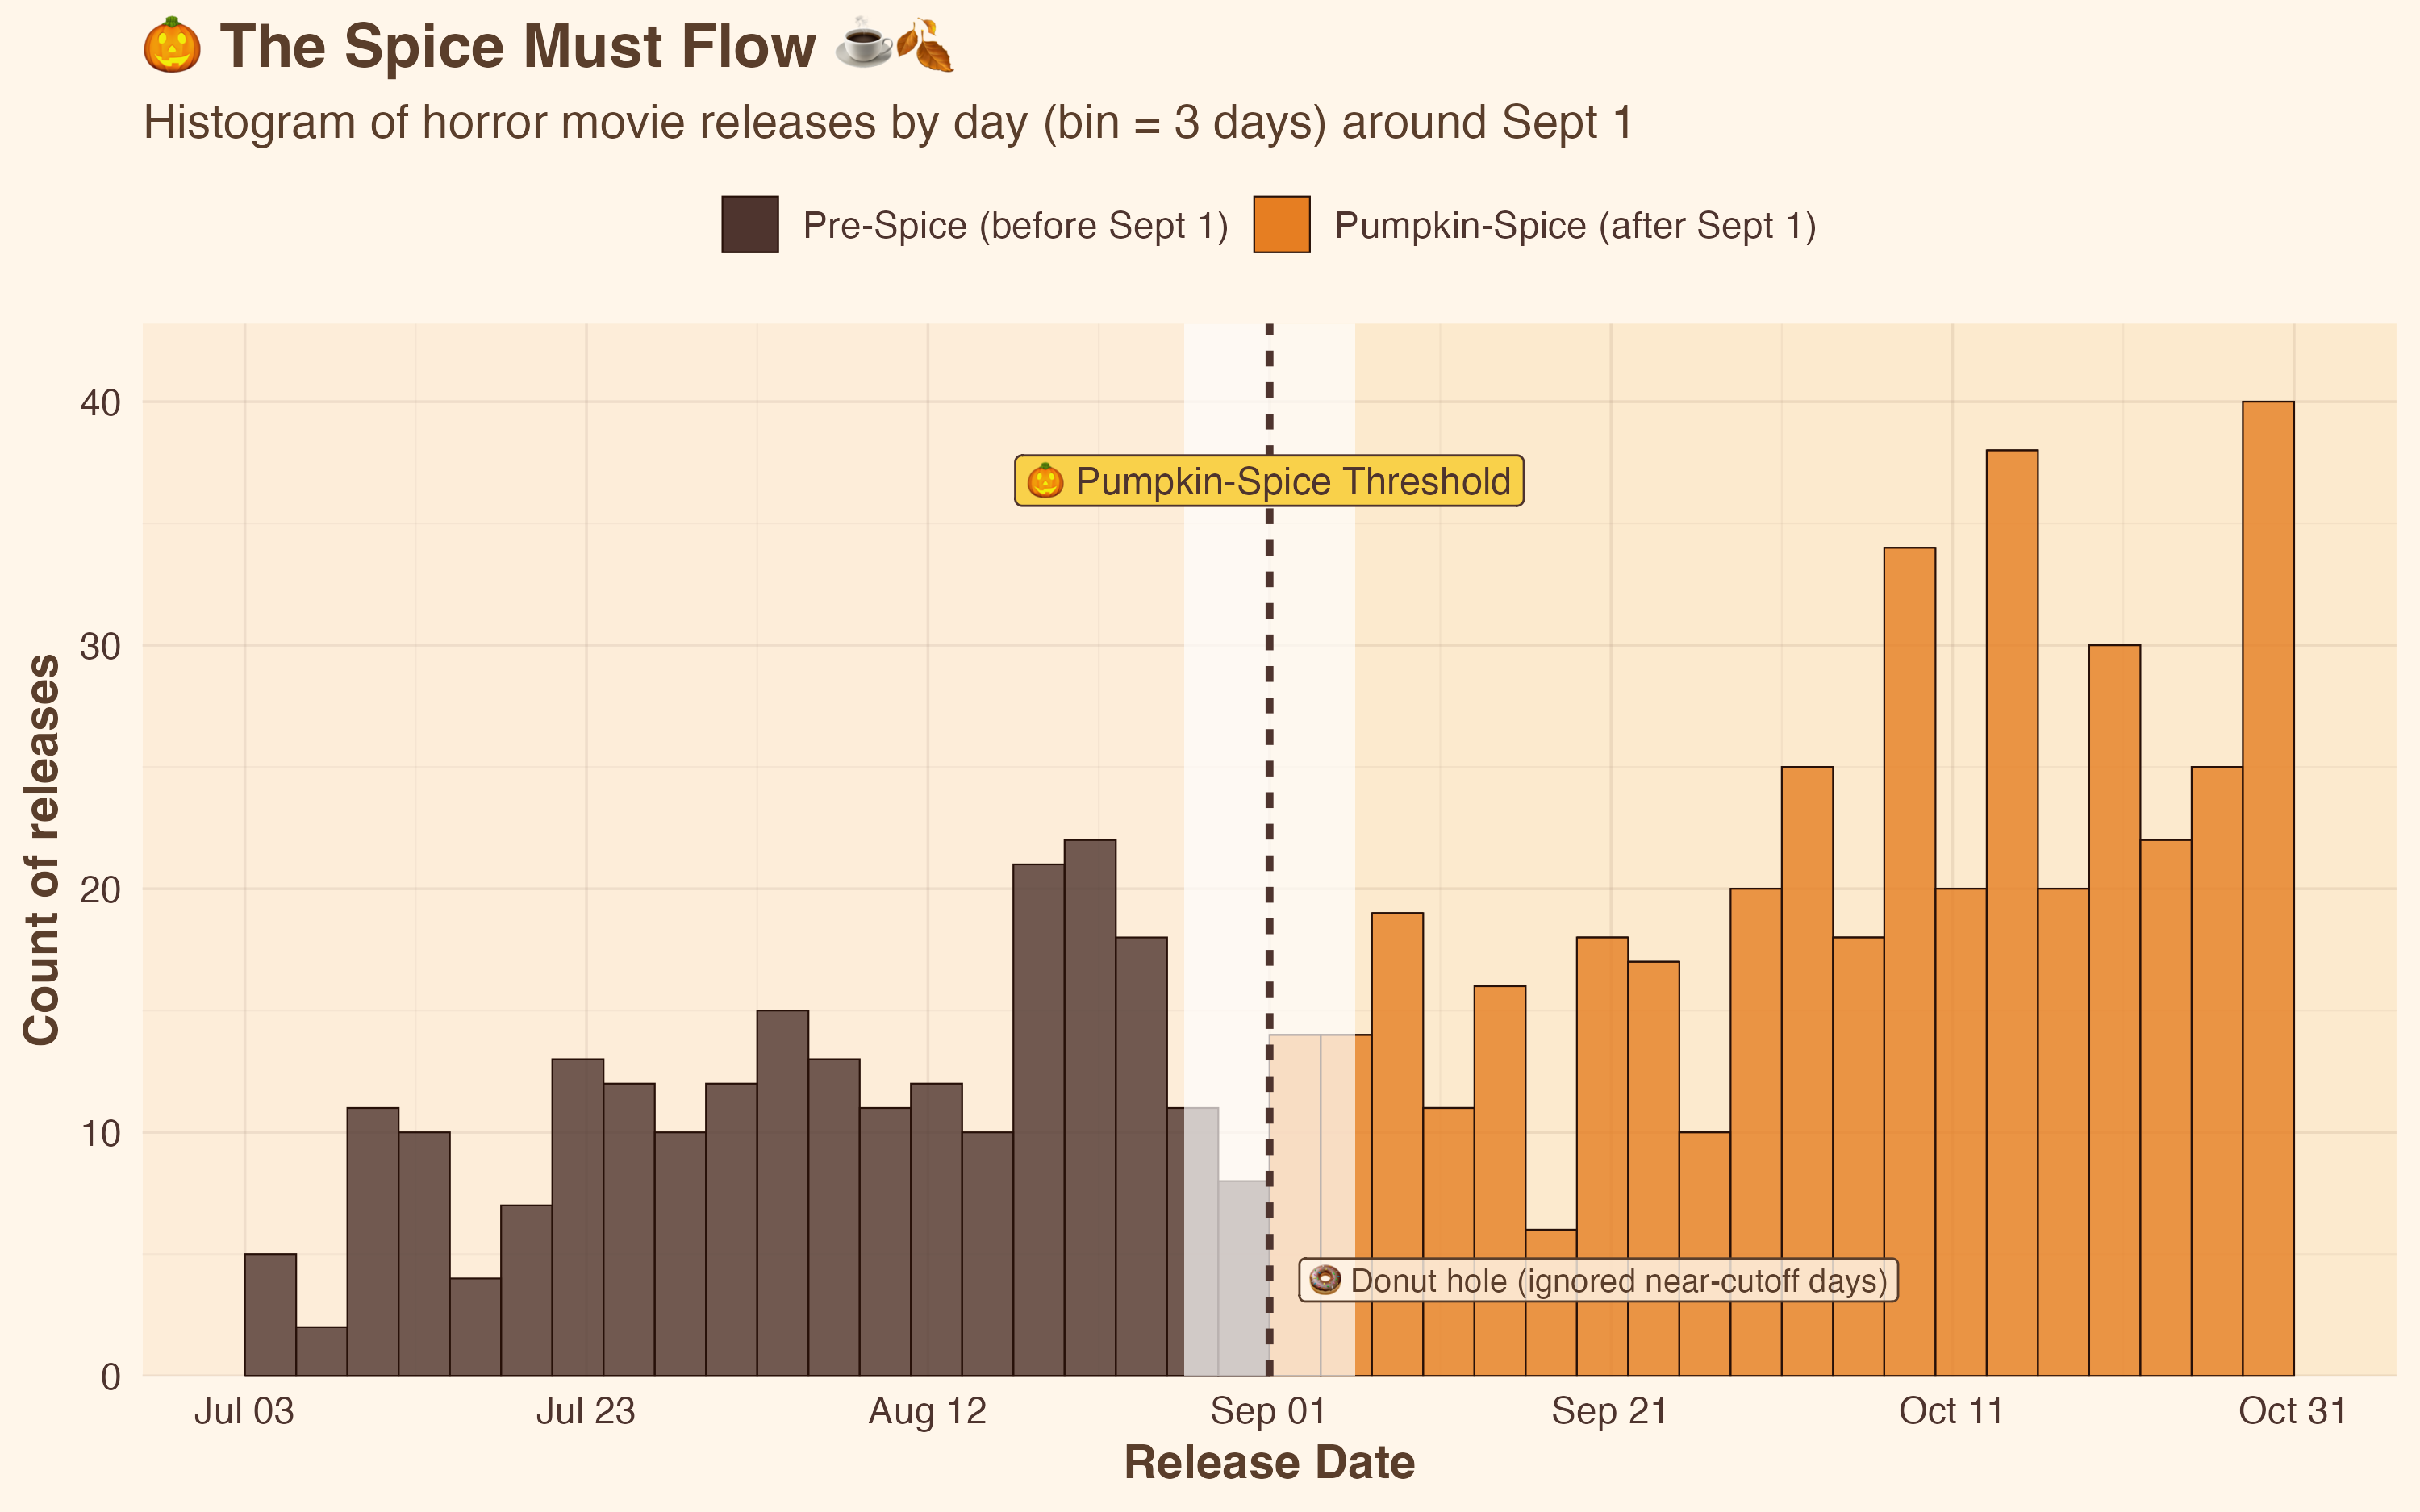
# Packagespkgs <-c("tidyverse","lubridate","stringr","scales","rdrobust","rddensity","ggplot2","scales","dplyr","gt","gtExtras")for (p in pkgs) if (!requireNamespace(p, quietly =TRUE)) install.packages(p)invisible(lapply(pkgs, library, character.only =TRUE))# ---- Load & prep data ---------------------------------------------# Expect columns: names, date_x ("MM/DD/YYYY"), score (0-100), genre, revenue, country, ...raw <- readr::read_csv("imdb_movies.csv", show_col_types =FALSE)dat0 <- raw %>%mutate(release_date =suppressWarnings(lubridate::mdy(date_x)),year_rel = lubridate::year(release_date), # get the year of release# running variable: days from Sept 1 of that year (negative = pre-spice)cutoff_date =as.Date(paste0(year_rel, "-09-01")),running =as.numeric(release_date - cutoff_date),treat =as.integer(running >=0),rating = score ) %>%filter(!is.na(release_date), !is.na(running), !is.na(rating10))# restrict to Horrordat <- dat0 %>%filter(str_detect(genre, regex("\\bHorror\\b", ignore_case =TRUE))) %>%filter(abs(running) <=60) # keep a ±60-day window around Sept 1# these are 644 horror movies within ±60 days of Sep 1
Steps taken:
Add a running variable: days +/- since Sept 1 of release year
Filter to within 60 days of Sept 1
Filter to horror movies
Main Results
Assumptions Check
Conclusions
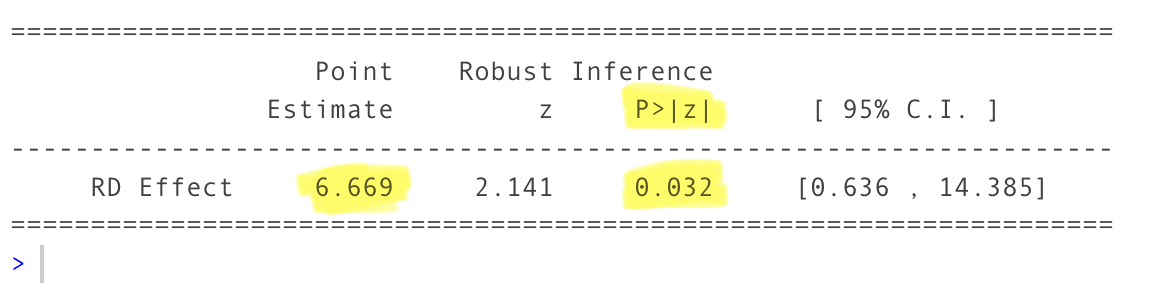
Entering into Pumpkin Spice Season on September 1st has a causal boost of 6.7 pts on horror movie ratings (\(p \leq 0.05\)).
A Polished Table
Sorted by ratings, here are the top 2.5%-percentile rated horror movies in the ±60 days released around September 1st – generated with the {gt} and {gtExtras} packages.